Visualizing Urban Data IdeaLab
VUDlab will be hosting an event to get people started making data visualizations using D3.js.
Our "On Ramp for d3.js" is designed to get people across disciplines the needed tools and know-how to create simple and easy-to-manipulate data visualizations. By the end of the night, we plan to have our participants complete two web-based visualizations and get the baseline tools needed to begin learning d3.js on a more serious level. Think of our event as your first crash course in creating interactive tools to show off your work! We will be providing food and soft drinks for everyone (don't worry... we got you).
You may be asking yourself, what is d3.js?
Data Driven Documents
D3.js is a javascript library developed by Mike Bostock while he was a student at Stanford University. D3 allows you to bind arbitrary data to a Document Object Model (DOM), and then apply data-driven transformations to the document. Do not get too overwhelmed with definitions right now. We will review all of this at the event. By the end of the night, you will have been shown all the shortcuts needed to get started making data visualizations on your own.
Check out one of the visualization we put together for KQED.org
Plan to Learn by Example
The Basics
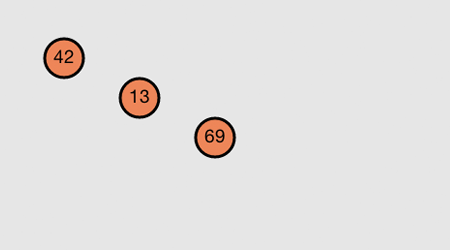
Three Little Circles

Medium
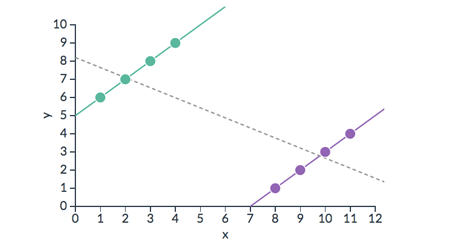
Simple Graphs

Advanced
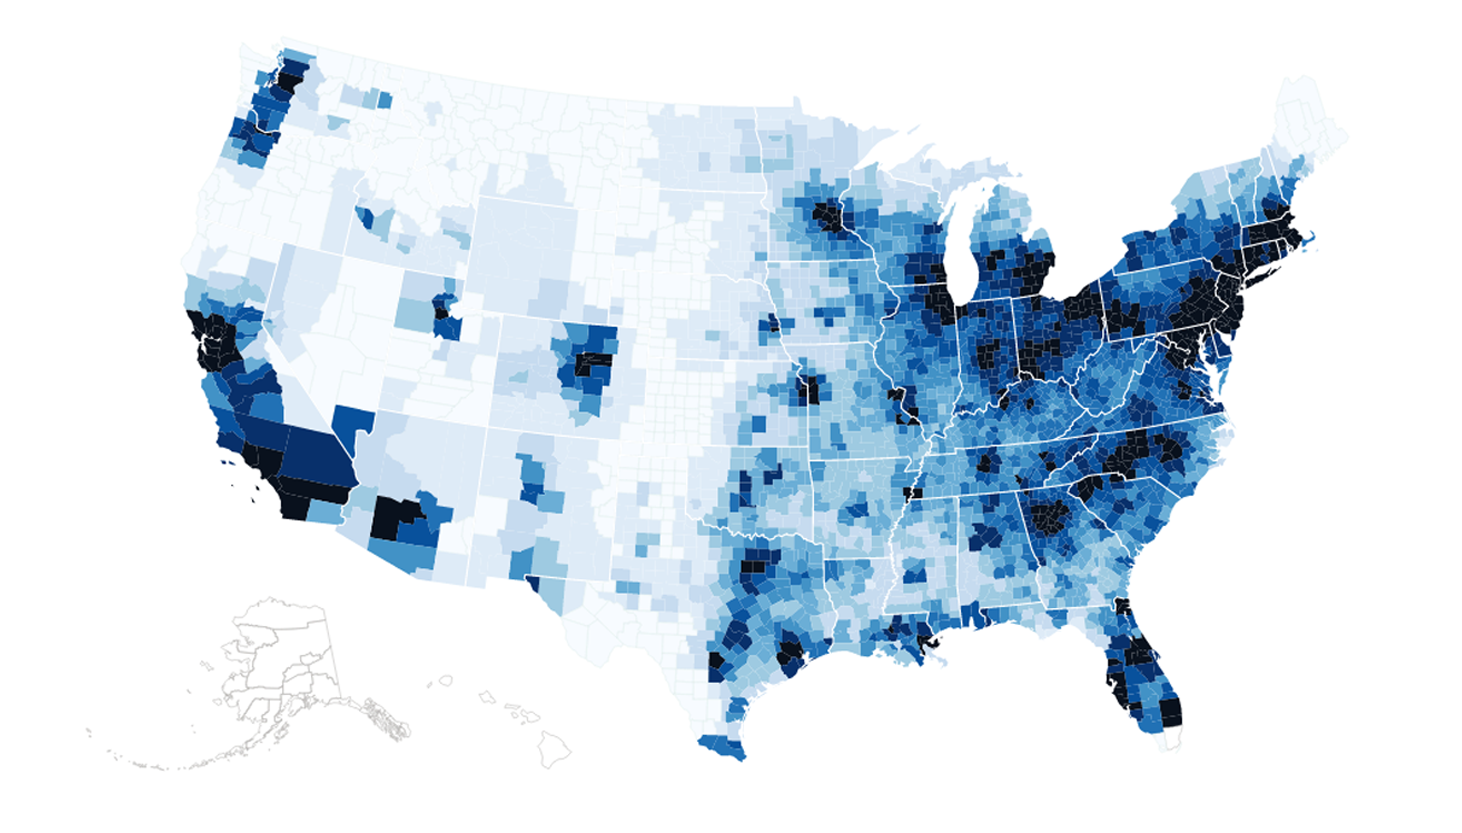
Simple Maps

Meeting Location
-
Where: Lower Level Blum Hall
-
•
-
When: Thursday, March 20th
-
•
-
Time: 6 - 9 PM